Navigating the Factory of the Future

With every employee has understandable information to make informed decisions and to track down problems.
As an integrated control hub mapd allows to observe deviations and errors, drill down into problems, and implement solutions.
Observe deviations and errors in seconds.

Liz is a supply chain manager at the plasma factory in
Covington, USA. She aligns the production to global and local
network teams and oversees the status of supply chain.
Liz Taylor
Liz's goals are
Observe

Investigate

Execute

Observe


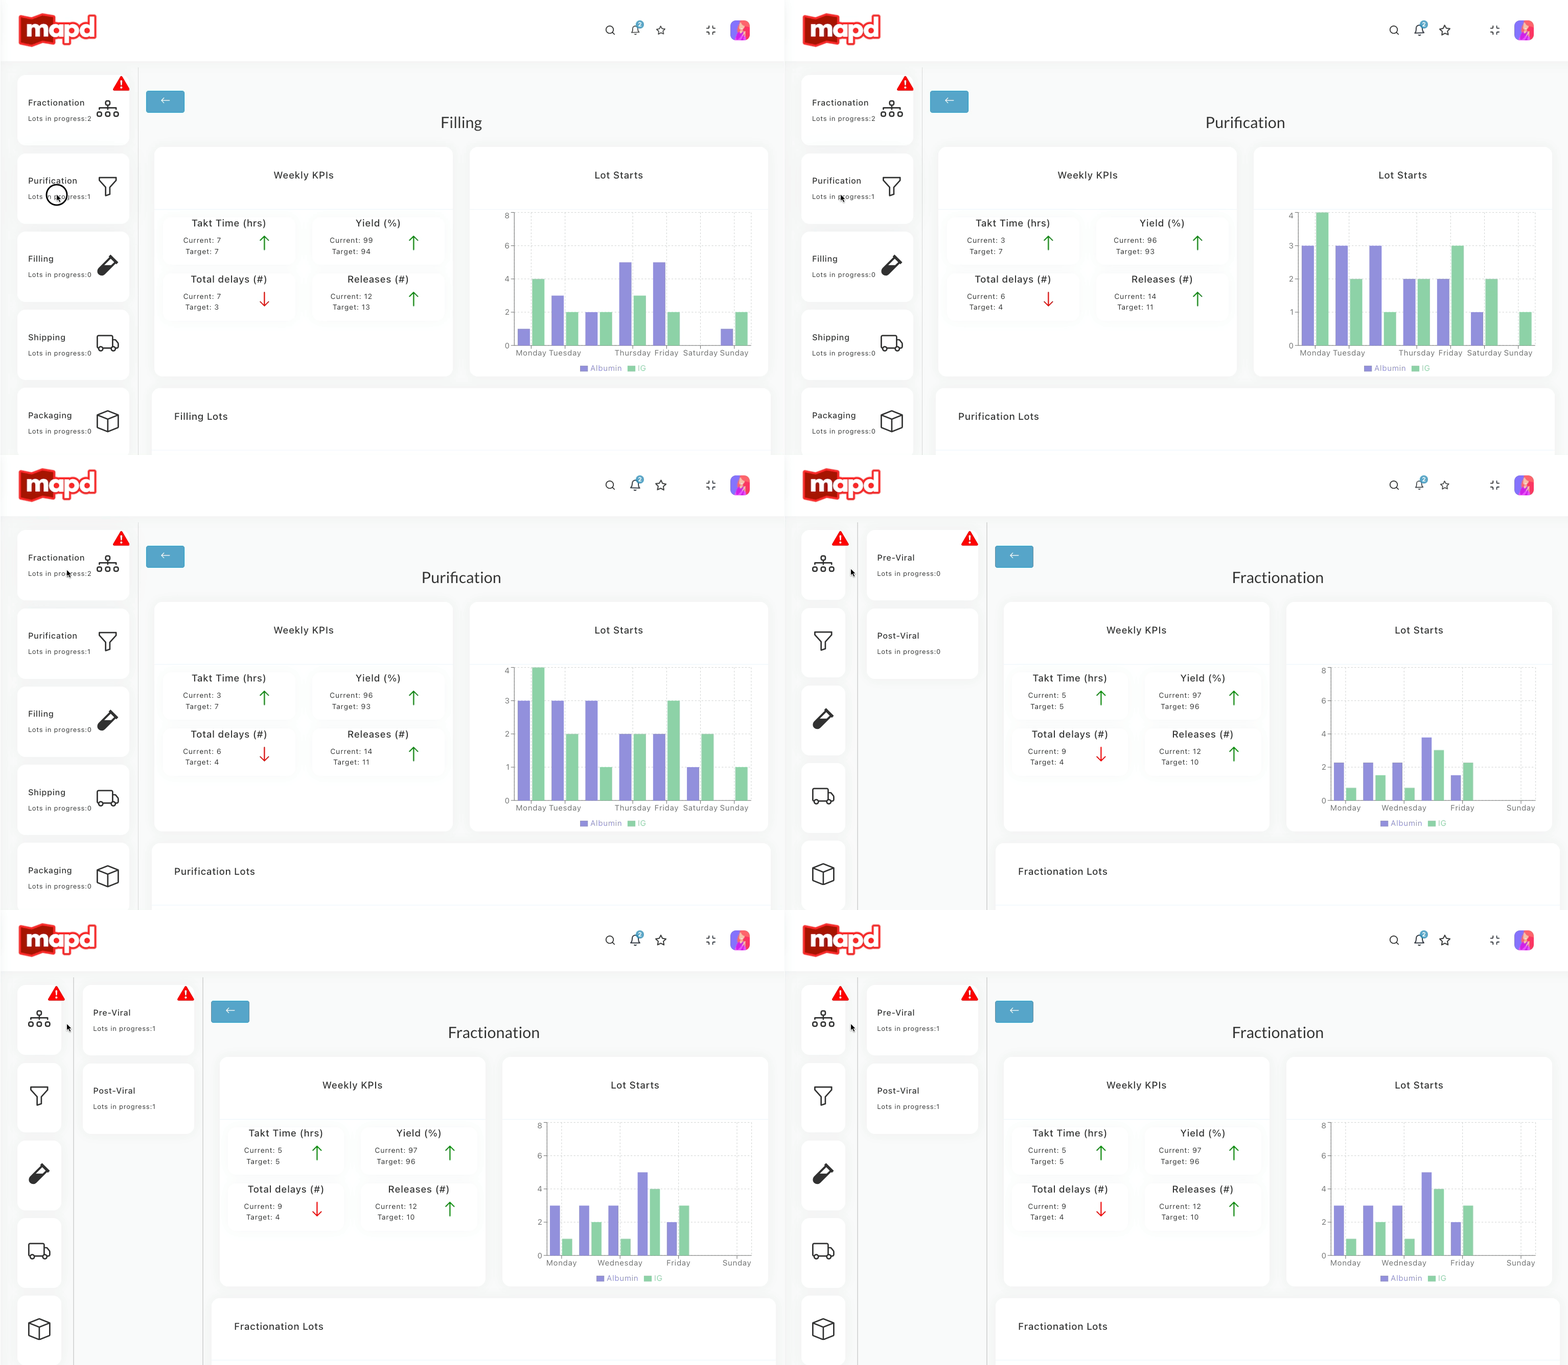
mapd gives a comprehensive overview over the status of the factory. This includes important KPIs and the status of the product.
Errors and delays are highlighted visually, so that they are easy to find.
Liz can explore the status using a hierarchical structure, making it easy to keep the overview about the current situation and where errors are located.
Status information is collected through communication

Identified Pain
Find deviations from the plan
Need
Investigate

mapd can automatically detect and highlight delays and show errors in the production. An automatic assessment of the errors shows work orders that are affected, so that the impact can be analyzed.
Liz can select the error and analyze the impact. The "Impacted Lots" tab shows which products are affected and might need to be replanned.

Identified Pain
Need
Devise mitigation Strategies
Impact predictions are manually created

Execute


mapd allows adjustments of the plan in context. By integrating different systems, it is able to show related work orders to the happening delay, and propose plan readjustments.
Liz is able to make a decision based on context information. She can share the information easily to other stakeholders by referencing the information in mapd.

Identified Pain
Need
Implement and communicate decisions
Without context changes are hard to communicate
Hierarchy View

mapd shows the factory as a hierarchical substructure, simplifying navigation and tracking down problems.
UI Elements

Color Coding
mapd uses colors to highlight trends, which helps to focus on the critical values while having all information at hand.

Dependency Visualization
Interactive Gantt charts allow seeing dependencies between work orders at a glance and make rearranging easy.
Our technology stack


Frontend
For the frontend we created a typed React app using Bootstrap and Semantic UI for styling and some helper libraries, including for example lodash.
Backend
In the Backend, we used python in combination with the lightweight micro-framework flask to serve the requests. We experimented with different techniques to store the manufacturing logs, first with NoSQL databases, but chose the SQL database SQLite finally. It provided more effortless possibilities to do analytic queries.

Deployment
It was essential for us to deploy updates to our prototype for user testing quickly. We, therefore, chose a semi-automated deployment strategy using Amazon S3 web storage and an EC2 instance for the Backend.